WHAT IS RETENTION?
Wouldn’t it be nice if every new user continued to engage with your product forever? That’s retention—a measure of the people who tried your product and liked it enough to return.
Many consumer-facing businesses define retention in terms of the percentage of users who take a given action (such as logging in, sending a message, etc.) within a certain period of time following sign-up. Subscription and SaaS businesses tend to define retention in terms of dollars spent within a certain period of time after the customer’s first spend.
In any case, retention is a good way to measure product-market fit and by far the best lever for product growth. Without retention, a growing product will eventually be left with no users. Retention affects every significant metric and is discussed in the context of other product concepts in our blog post on product health.
While retention is framed primarily as the percentage of users returning to the product itself, it is also useful to understanding specific product features and subpopulations of users. For example, you can examine how retention varies by geography, gender or behavioral characteristics (e.g., daytime vs. nighttime use) to paint a clearer picture of your users. Similarly, at the feature level, you can examine how users interact with individual features and then use that knowledge to guide prioritization and the product roadmap.
Before you invest in acquiring new users through marketing or paid channels, you should understand how to strengthen and stabilize retention for early users. If retention is weak, few users will stay long-term, and you will churn through the total addressable market with little to show for it—at great expense.
UNDERSTANDING RETENTION
Retention is generally depicted by plotting the percentage of users who return to either the product or a core feature over time. There are three archetypal retention curves (see Figure 1).
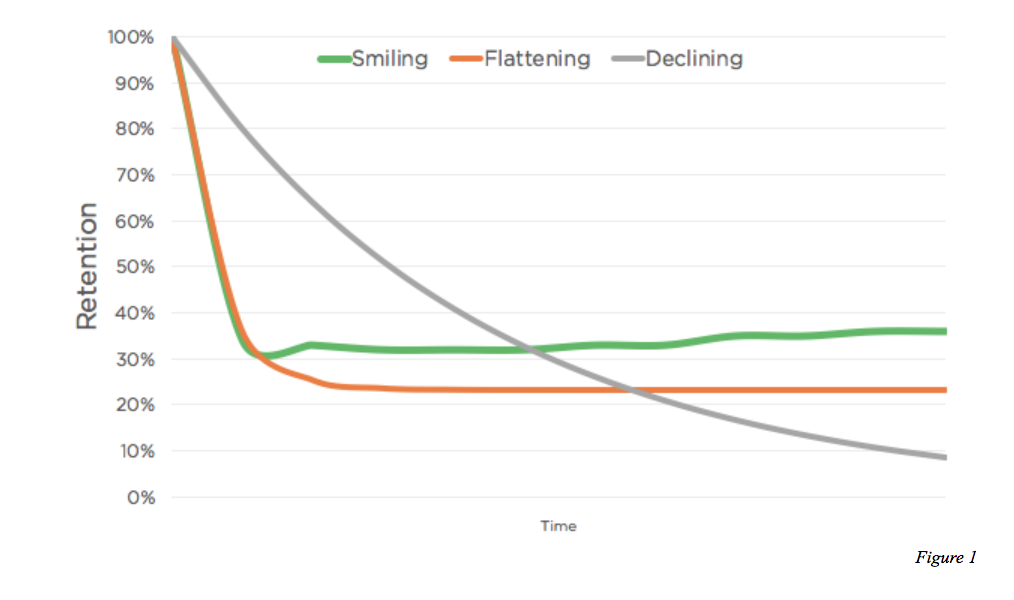
Flattening curves This archetype suggests that a percentage of users who sampled the product found value in it and continued to return to it over time. Not all flattening curves are equal, however. The higher the level at which the curve flattens, the higher the long-term retention and the healthier the product. In Figure 2, the curve 2 flattens at a higher level, indicating a healthier product.

Declining curves When a product has not achieved product-market fit, the retention curve will continuously decline, eventually reaching very few or zero users. In this situation, it is important to focus on changing the product to find a value proposition for a core set of users and then expanding from that set. As shown in the case of BranchOut, applying growth-hacking techniques at the top of the funnel without fixing underlying weak retention will lead to a “leaky bucket” outcome, in which users simply pass through your product.
Smiling curves When a product is truly exceptional, its retention curve will actually rise as product development and network effects propel churned users to return during a Hyper Growth phase. In these situations (see Figure 3), users eventually return to the product eventually after initially churning away.

For most products, including those with smiling retention curves, retention will eventually trend to zero as the product is disrupted by competition, shifts in user behavior and other factors. For games in particular, the time frame of these shifts tends to be relatively short as users move on—for example, Angry Birds was extremely popular in the early part of this decade, amassing tens of millions of monthly users, but currently has only a few hundred thousand.
RETENTION MEASUREMENTS
Retention is measured relative to two factors: time frames and events.
Depending on the vertical of your product, a daily, weekly or monthly time frame may be most meaningful. An e-commerce or travel product might expect users to come back once per quarter, whereas a social app or game would expect daily usage. Measuring retention against these expected time frames is key; to look at monthly retention for a product with a natural weekly frequency, for example, would lead to an inaccurate account of product health.
When considering events as they relate to retention, it’s also important to define what constitutes meaningful activity. Is a monthly active user anyone who simply logs in at least once per month? Anyone who has a five-minute session in a month? Purchases an item? Posts a message?
For example, a ridesharing app such as Uber or Lyft would define an event as a completed ride, rather than an app open. Content streaming services such as Spotify and Netflix might define an event as beginning to listen to, or view, a piece of content. For a messaging app, it might be when a user writes or reads a message.
In addition to product-level retention, you may also want to define feature-level retention, where the event is defined as using a particular feature of the product. For example, Amazon could measure how its Wishlist feature is used to help prioritize feature development and the product roadmap.
Triangle retention chart Retention by temporal cohort is a useful visualization to monitor frequently. The most common way to visualize temporal cohort retention is with a triangle retention chart (Figure 4). Each row of the chart corresponds to a temporal cohort, with the size of the cohort, in users or dollars, listed in the first column (0). Subsequent columns (1–22) show the percentage of that cohort remaining after a given period of time.

By assigning colors to certain percentage values, you can quickly identify changes in retention, which will typically appear as horizontal, diagonal or vertical features.
Horizontal features identify cohort-specific traits. For example, if you were to run an acquisition campaign or expand to a new market expansion in a given month, you might see a horizontal feature emerge showing improved or diminished retention particular to that cohort. In Figure 4, the February 2016 cohort is significantly larger than previous or subsequent cohorts (perhaps as a result of an experimental acquisition campaign or a referral feature), and retention for that cohort is relatively poor.
Diagonal features are usually a result of product feature releases, news or other events that affect overall usage. For example, the #DeleteUber campaign affected every Uber cohort, not just the ones who started using the service in January 2017 (when the campaign began to trend). Diagonal features may also indicate product outages or breakage: when AWS had service outages in early 2017, many companies’ retention charts exhibited a diagonal feature for that day, as users couldn’t access their products.
Vertical features are commonly seen in subscription businesses that have annual plans, as well as in those that offer trials. For example, a dollar or transaction retention chart for Amazon Prime would likely show a significant vertical feature every 12 months, when portions of cohorts renew their yearly memberships.
In addition to helping visualize retention, the first column of a triangle retention chart can give you a sense of your new user growth: Is it increasing? Do you see more users signing up on the weekends? You may also see the impact of exogenous events as a suppressed or increased new user sign-up in the first column.
Since total retention is the weighted average of your cohort retentions, it is especially important to track any cohorts that are dramatically larger than others. For example, if in January the product acquires 10 times the number of total users acquired in December, your overall retention is more or less determined by the January cohort.
Composing time frames As discussed above, it is important to choose the appropriate time frame when measuring retention. For monthly, quarterly or annual products, however, there may be a long delay between implementing a product change or updating an acquisition strategy and understanding the impact on retention.
In these instances, we can break down long-term retention of a cohort (364 days in the equation below) into multiple ratios. This equation can be understood from left to right as a funnel of users, where D1/D0, or the “D1 retention rate,” is the fraction of your cohort retained for one day, and so on. (D0 is the number of installers in a cohort and D1 is the number in that cohort who still use the product after one day.)

If D7/D1 stays relatively constant for all cohorts, but the D1 retention rate appears to be declining, focus your attention on improving D1 retention, as this will likely be the biggest lever for long-term retention. Likewise, if D1 retention is flat but D7/D1 is declining, focus on finding new ways to engage users in the first week rather than the first day. Ultimately, your goal is to increase long-term retention, but it is important to monitor these fractions, as well, as they are early indicators of future retention trends.
HOW TO IMPROVE RETENTION
Tactics for improving retention vary widely based on the circumstances of the product, technology and user base. Once you have decided on the right retention metric, your goal will depend on your type of retention curve, as defined in Figure 1:
- Declining curves: Flatten the retention curve of each cohort.
- Flattening curves: Elevate the long-term retention of flattened curves.
- Smiling curves: Celebrate!
The techniques below will help you improve retention for different segments of your population, but the unifying theme across all populations is to increase engagement. As we discuss in a previous post, engagement drives retention. (We will offer additional guidance on engagement in a future post.)
Engage retained users Retaining existing users is key to growth and is accomplished primarily through engaging them—by providing value in the product. Your most important users are the “super users” who are most engaged and thus best retained. Understanding how this group interacts with the product is the best way to improve overall retention.
To identify your super users, first hypothesize which features are core to the product’s value proposition, which is frequently referred to as the product’s “magical moment.” PayPal’s magical moment is a successful transaction; for Amazon, it is a seamless delivery experience. Once you’ve identified your “magical moment,” segment your users based on how, and how frequently, they engage with it. (We plan to cover this topic in more detail in a future post on exploratory analysis.) The most frequent users of any particularly valuable feature are your super users: they watch the most videos, share the most content, create the most messages, etc.
Once you’ve identified these users, examine their prior behavior. What features did they use early on? Did they encounter the magical moment a certain number of times before they reached a “tipping point” and became truly hooked on the product? For example, Facebook famously discovered that connecting to seven friends in 10 days greatly improved retention—which led to a product strategy that encourages users to reach that milestone.
Early on, you should focus on building a product that will delight super users. Then, once you have identified their key behaviors and engagement tipping points, you should use those insights to create a playbook for motivating less-engaged users to behave similarly, which will ultimately drive better retention.
Remove friction for new users The most efficient way to improve retention is to bend the shape of the retention curve as early as possible. For most products, especially new ones, the curve is fairly steep for the first several days, weeks and months. Users churned during this period represent the vast majority of all churned users, so driving new user engagement (and thus retention) early on is especially valuable.
To improve retention among new users, it is important to understand the sign-up (or acquisition) funnel. For example, how many people viewed an advertisement for the product, and on which channels? How many then clicked on that ad? How many then created an account, and how many were retained 7 days later? 24 days later? 84 days later?
Studying the drop-offs in users at each stage will help you understand the efficacy of your acquisition channels (paid and unpaid) and identify any problems in sign-up and onboarding flow. For example, a significant drop-off between sign-up and account confirmation suggests an issue with confirmation email delivery. As another example, when the team at Poncho, a weather chatbot, studied and revised the number of questions in their sign-up flow, their seven-day retention increased from 60 percent to 80 percent. To further isolate points of significant drop-off, filter your data by channel, device, etc. Removing these sources of friction helps new users arrive at the “magical moment” as quickly as possible, which will dramatically improve retention in this group.
A well-designed onboarding guide that clearly communicates your product’s value proposition and guides new users toward the tipping point of engagement will also strongly influence retention—not only for new users, but for all users.
GUIDING PRINCIPLES
Benchmark your product To establish the “correct” level of long-term retention for your application, set benchmarks based on similar products in your genre. For example, a game developer might compare their product to other games of the same type.
Table 1 shows the difference in 30-day retention rates between several successful casual puzzle games (7–10 percent) versus well-known strategy games (more than 30 percent). A casual game that has 20+ percent D30 retention and a 35 percent D30/D1 ratio would be well ahead of top casual games such as Angry Birds. But a social or strategy game with the same metrics would be significantly behind the leaders in its genre.

Engagement drives retention Because engaged users are less likely to churn, engagement metrics such as the ratio of daily active users (DAU) to monthly active users (MAU) correlate with and drive retention. Similarly, slipping engagement metrics are leading indicators of problems with downstream retention. If engagement declines, act quickly to remedy the situation before retention is affected.
Reduce churn early Monitoring and acting on changes in early retention (D1, D7, D28, etc.) are crucial to achieving strong long-term retention. For most products, users churn early; stanching this outflow will lead to better retention over longer time frames.
Newer cohorts retention depends strongly on the product type, phase of the product and its market penetration For most products, the earliest adopters of the product are generally the most excited about the product and retain the best. Until the product achieves product market fit, the later cohorts generally retain worse than the earliest adopters for whom the product fits a more immediate need. As the product starts to do better achieving strong product market fit and enters the growth and hyper-growth phases, the retention of users improves again as more people begin to see the value of the product. As such, the cohort retention of products may vary a lot depending on the phase of growth.
Moreover, products with network effects will likely see retention correlate across cohorts. Early on, when there are few users, users in cohorts may churn as there are few relevant connections (social products) or content available (professionally and user generated content products). In the growth and hyper growth phase for network-driven products, more users are drawn to the product and generate more content increasing retention and in turn resurrection from older cohorts. For non-social products, the retention of newer cohorts may not be correlated with how well older cohorts are doing.
For both network-driven and non-network-driven products, cohort retention will fall once penetration is very high — the marginal user at this point will be at the periphery of the core user.
Retention can be applied at a feature level The retention characteristics of your product may not mimic those of individual features. For example, a product might have excellent retention overall, while retention of its messaging and image-upload features is significantly lower. Wide variations are not uncommon between individual features. To ensure your product reaches its full potential, you should recognize this reality and analyze the retention of individual features as well as of the product itself.
CLOSING THOUGHTS
Retention can be used to understand how well your product is growing overall, to evaluate its use among subsets of users and to determine how specific features are performing. Ultimately, retention is driven by increased engagement and removing friction. Exposing users to your product’s magical moment as early and as frequently as possible will reinforce your product’s value proposition and drive them to return to the product, as well as to engage more deeply and more frequently. This will first increase short-term retention and later manifest in better long-term retention, putting your product on the road to sustainable growth.
TAKEAWAYS
Retention is a measure of the people who tried your product and liked it enough to return; as such, it underpins all significant metrics.
Think of retention as a funnel. Breaking down the long-term retention of a cohort into multiple ratios can help you identify the early indicators of long-term retention as well as the biggest levers for long-term retention.
Techniques for improving retention vary by user population. Retained users should be increasingly engaged, while new users should experience minimal onboarding friction. Exploratory data analysis will help identify precise levers for each population.
Follow us on Medium for weekly updates.
This work is a product of Sequoia Capital's Data Science team. Jamie Cuffe, Avanika Narayan, Chandra Narayanan, Hem Wadhar and Jenny Wang contributed to this post. Please email data-science@sequoiacap.com with questions, comments and other feedback.
