Previous posts in this series examined the product, seasonal and other external factors that can affect your key metrics. In this post, we consider another factor: mix shift.
“Mix” has multiple meanings, and is sometimes known as Simpson’s Paradox. A company’s “sales mix” is the proportion of each product it sells relative to its total sales. Similarly, “user population mix” is the proportion of a specific user base (for example, users from a given country) relative to the overall user base.
A change in a mix over time is known as “mix shift.” For example, a product’s daily active users (DAU) might be 75 percent from the United States and 25 percent from the rest of the world (ROW) at time t1, but 60 percent U.S. and 40 percent ROW at time t2. In this case, you might see no change in TS/DAU (time spent per daily active user) for the U.S. and ROW groups individually, but still see an increase in TS/DAU overall.
For example, consider Amazon Prime in the U.S. Figure 1 shows how the average transaction value on Prime has changed over time, which is due to both price adjustments and mix shift of various groups. Amazon Prime offers different prices for regular, student and low-income customers, as well as annual and monthly plans and occasional sales.
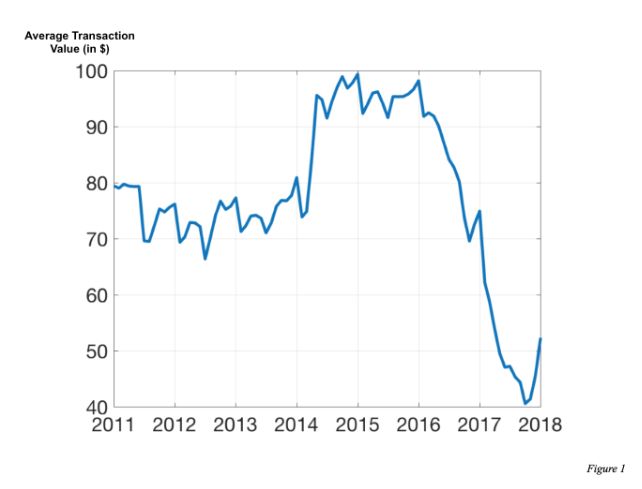
The drop in average price per customer over 2016 and 2017 is almost entirely attributable to greater adoption among low-income, monthly and student members, all of whom pay lower prices than other customers. The pricing of each product stayed the same during this period; it was the mix of customers that changed. Complete information on the mix of customers during this time period would allow us to accurately attribute each change represented in Figure 1 to mix shift factors.
Imagine you were investigating TS/DAU at a consumer company at two times, t1and t2, and wanted to attribute the change in TS/DAU to mix shift versus all other changes. The following extreme cases demonstrate how to identify the impact of mix shift.
CASE 1: PURE MIX SHIFT EFFECT
At time t1, TS/DAU for U.S. users is 10 minutes per day; for ROW, it is 5 minutes per day. 80 percent of users are from the U.S., and overall TS/DAU is therefore 9 minutes per user.
At time t2, TS/DAU remains unchanged t1 for both the U.S. and ROW. However, the mix of users has flipped: the U.S. now has a 20 percent share, while ROW has the other 80 percent. The new overall TS/DAU is therefore 6 minutes per user—a decrease of 3 minutes per user that is due entirely to mix shift.

As this example shows, even if there is no change in product nor in individual users’ engagement, mix shift can still drive a decrease in overall engagement.
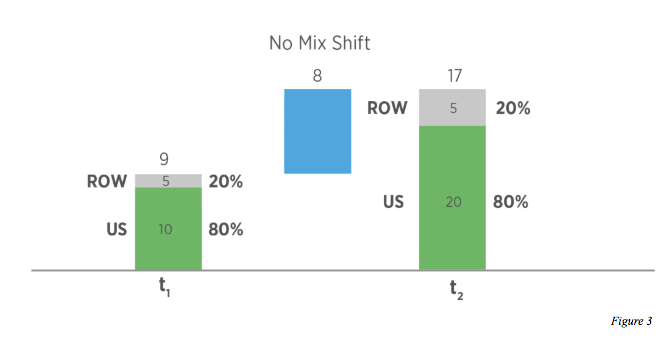
CASE 2: NO MIX SHIFT EFFECT
At time t1, TS/DAU is again 10 minutes per day for U.S. users and 5 minutes per day for ROW. The U.S. again has an 80 percent share of users, for an overall TS/DAU of 9 minutes per user.
But at time t2, TS/DAU changes for the U.S., increasing to 20 minutes per day, while it remains the same for ROW. The share also remains exactly the same. The new overall TS/DAU has therefore changed to 17 minutes per user—an increase of 8 minutes completely attributable to the increase in U.S. user engagement with no mix effect.
These two examples are extreme; in practice, overall engagement is usually driven by both mix effects and inherent changes in engagement. It is relatively easy to come up with the formula to quantify these effects.
Mix shift effects can be analyzed across multiple dimensions: country, region, platform, age, gender, connectivity class, device class, etc. For the most effective mix shift analysis, you should first carefully examine the problem and develop a hypothesis regarding mix effect.
TAKEAWAY
Analyzing mix shift can help you identify the effects of changes in the population mix versus inherent changes in user engagement.
Follow us on Medium for weekly updates.
This work is a product of Sequoia Capital's Data Science team. Jamie Cuffe, Avanika Narayan, Chandra Narayanan, Hem Wadhar and Jenny Wang contributed to this post. Please email data-science@sequoiacap.com with questions, comments and other feedback.
